Conjoint Analysis
Discover the true drivers behind the choices your customers make, using Gradient's sophisticated statistical conjoint models.

Find out the true drivers behind the choices your customers make
Why you need a conjoint analysis
We are constantly making choices, some conscious, but most unconscious. Standard methods with traditional question scales are unable to reveal what component of a product or concept drives its preference.
Most of these scales don’t simulate real-life conditions, which always include some type of situational trade-offs. To simulate realistic consumer decision making, the most precise approach is through either a conjoint analysis or MaxDiff analysis. Gradient has designed countless experiments within a wide range of product types and sectors.
Identify the optimal combination of product attributes
Simulate realistic shopping experiences
Understand how market changes affect consumer behavior
What is conjoint analysis?
How it works
Conjoint analysis is a technique for quantifying how the attributes of products and services affect preference. It is typically used to help identify the optimal design of products, messaging, and pricing.
A conjoint compares combinations of attributes. Each respondent is shown multiple lists with varying combinations of the attributes.
Across multiple lists of choices from hundreds of respondents, a statistical model identifies precisely how much each attribute and level contributes to making the decision.
We will design a conjoint experiment in tandem with your needs
We use state-of-the-art statistical techniques to connect the dots from the survey inputs to your research needs
With custom visuals and easy-to-understand diagrams, we deliver a shared vocabulary to interpret the results
You get the ideal blend of a storytelling art-form and scientific rigor
What you get
-
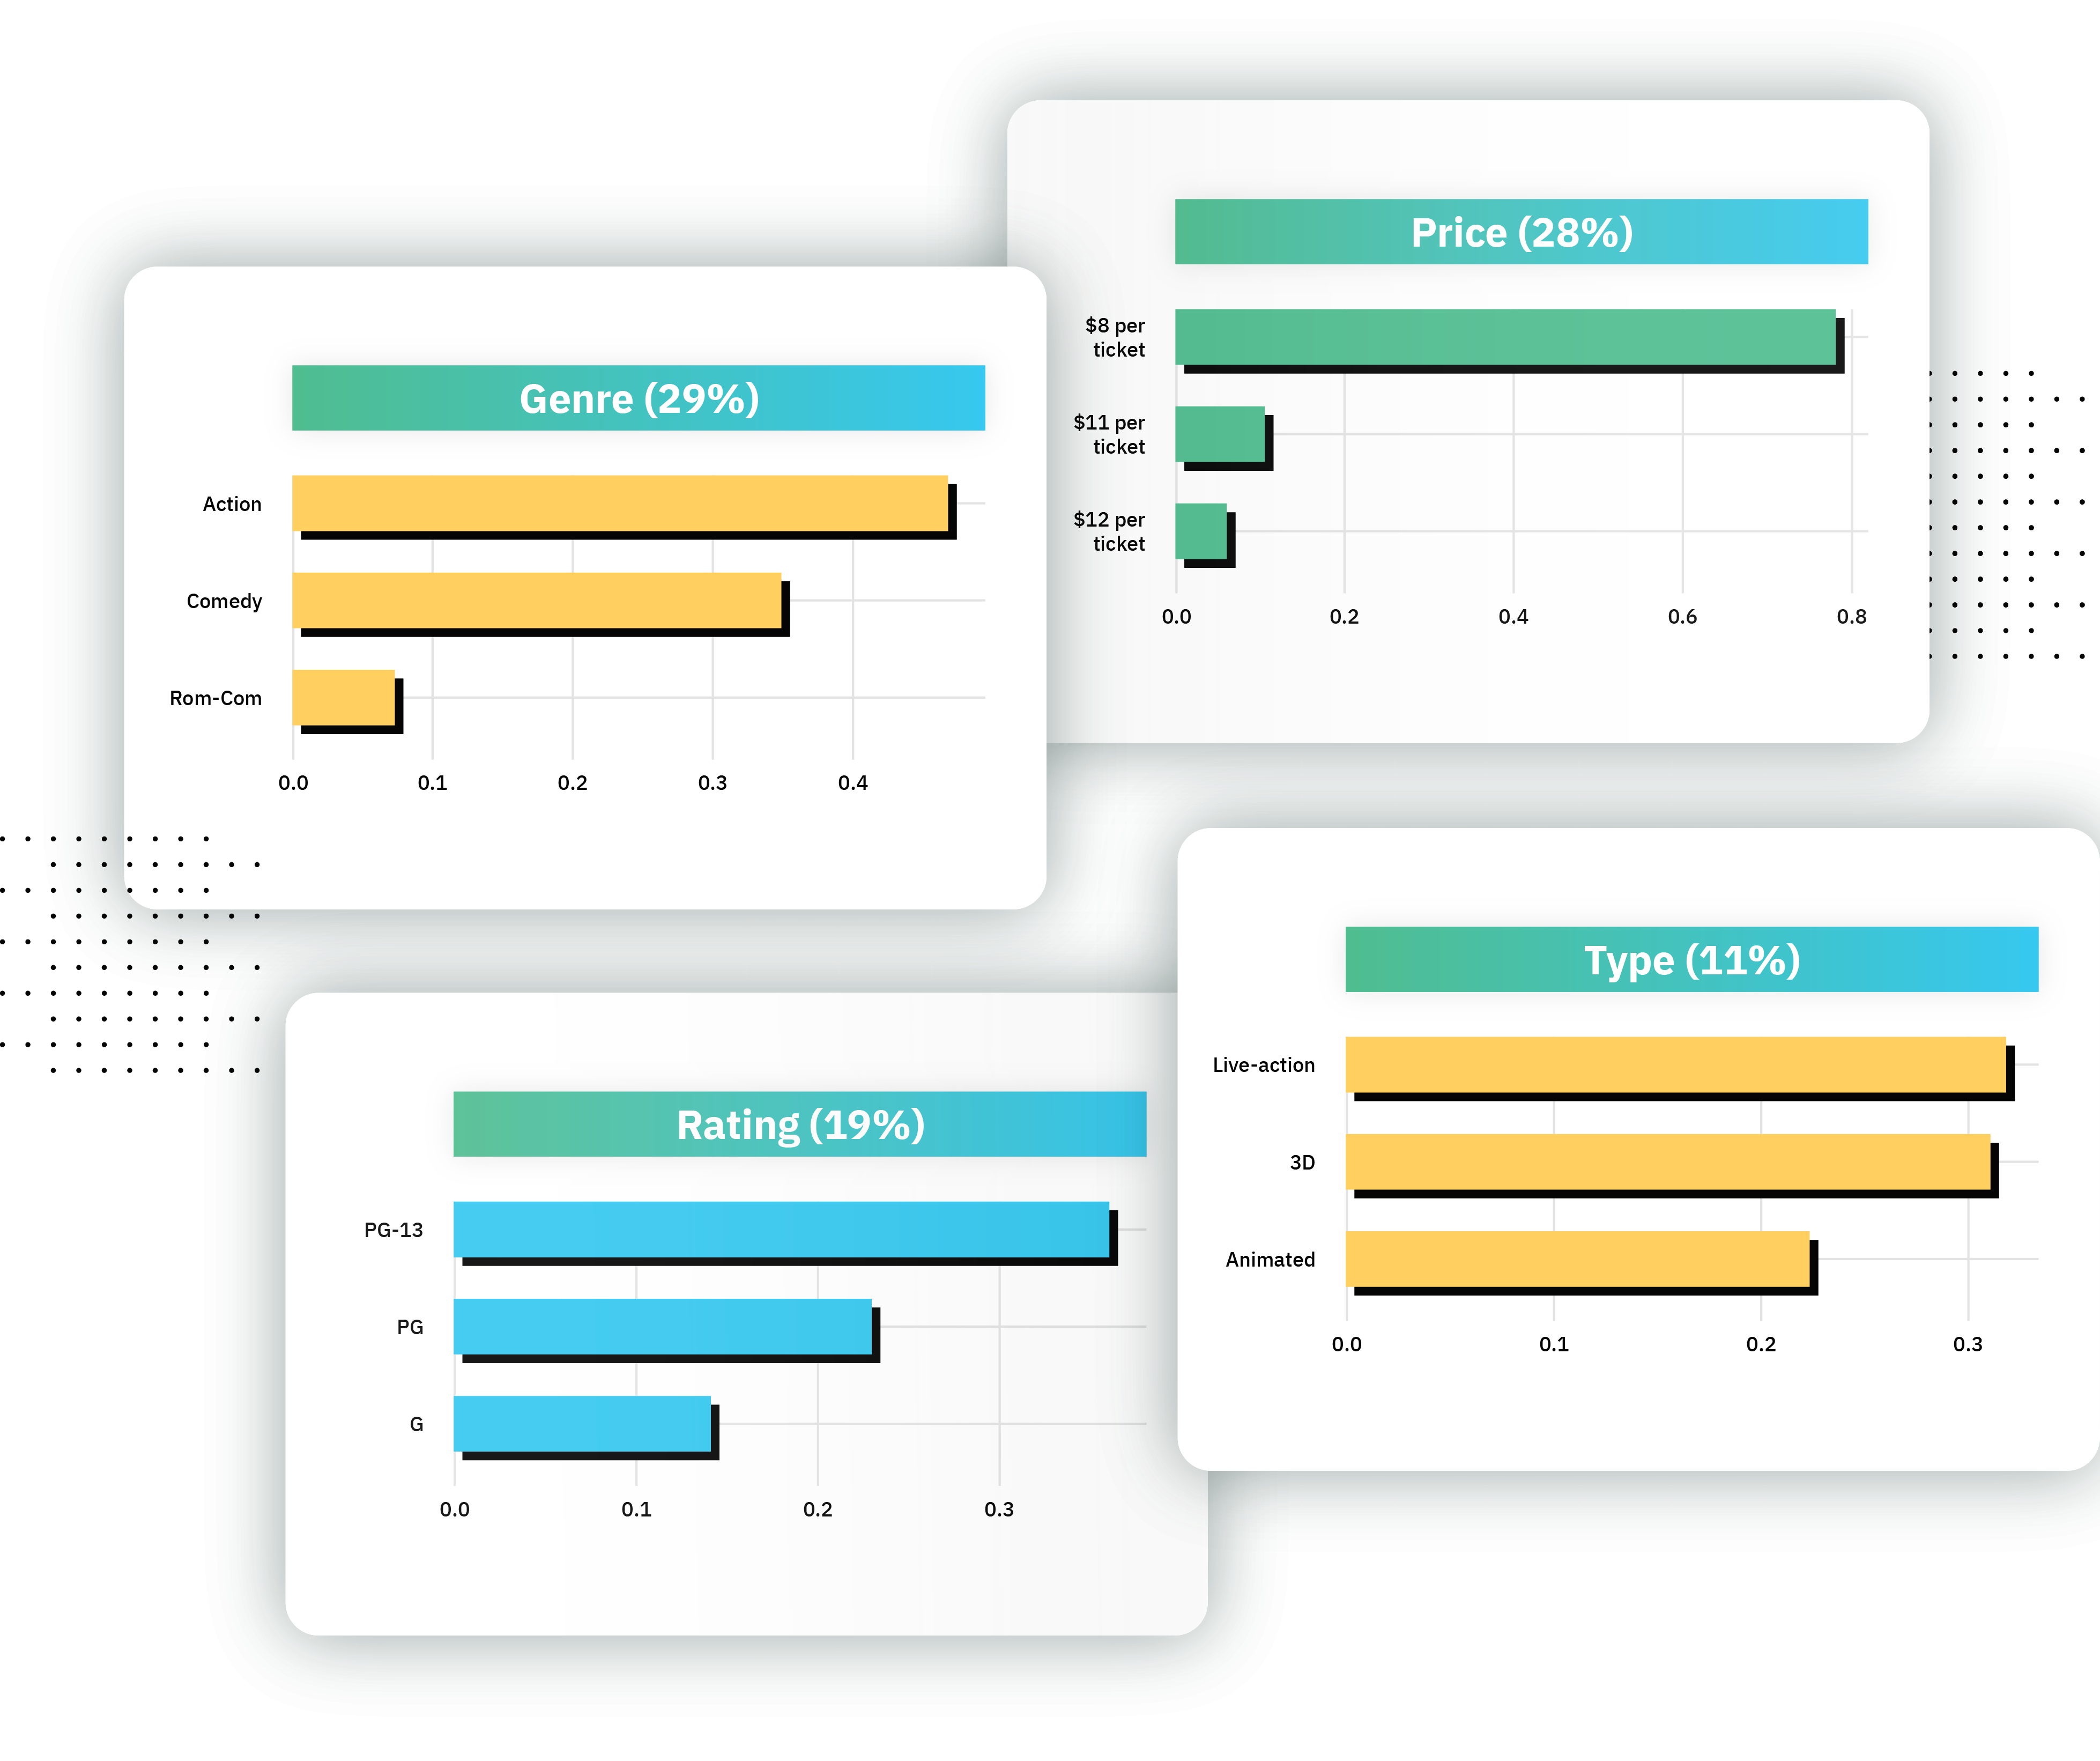
Attribute & Level Importances
The attribute importance is the proportion that a larger category or attribute (e.g. genre), contributes to driving preference.
The level importance is the proportion that a specific level within an attribute (e.g. within the genre attribute, drama and action) contributes to preference.
-
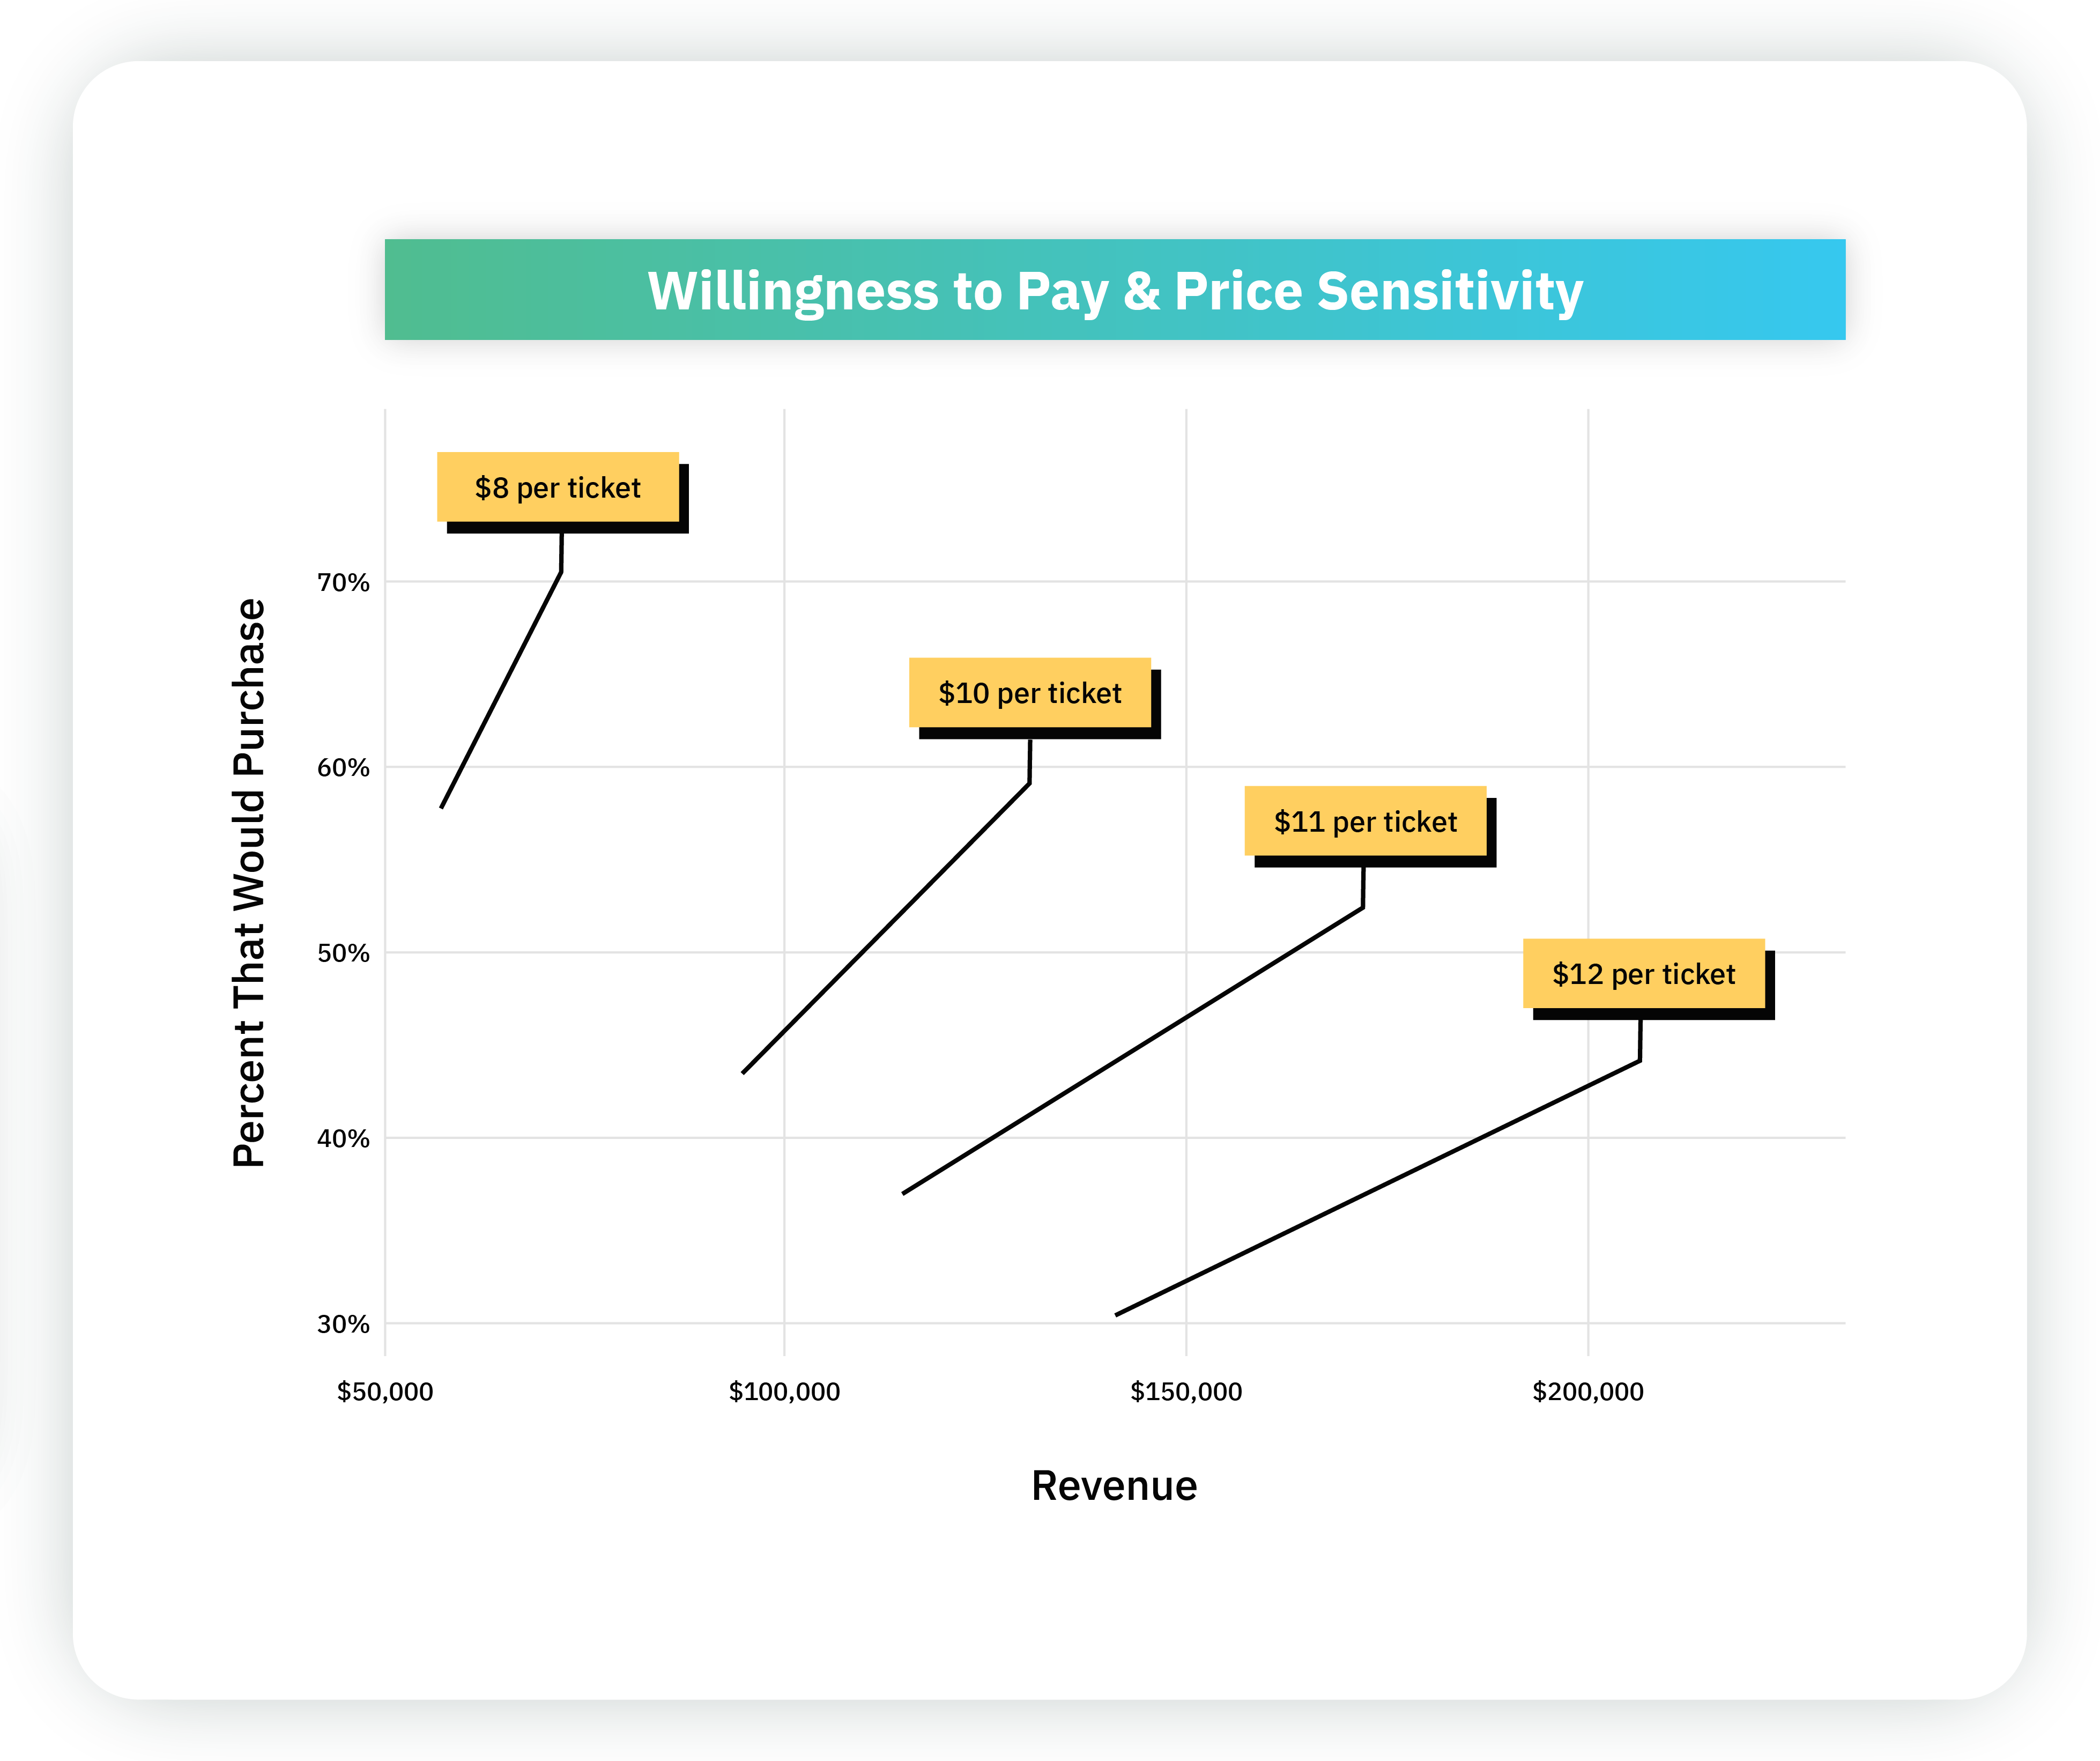
Willingness to Pay & Price SensitivityA willingness to pay (WTP) analysis reveals how much customers are willing to pay for a specific combination of levels, and the extent to which customers will prefer a different combination at a different price level.
-
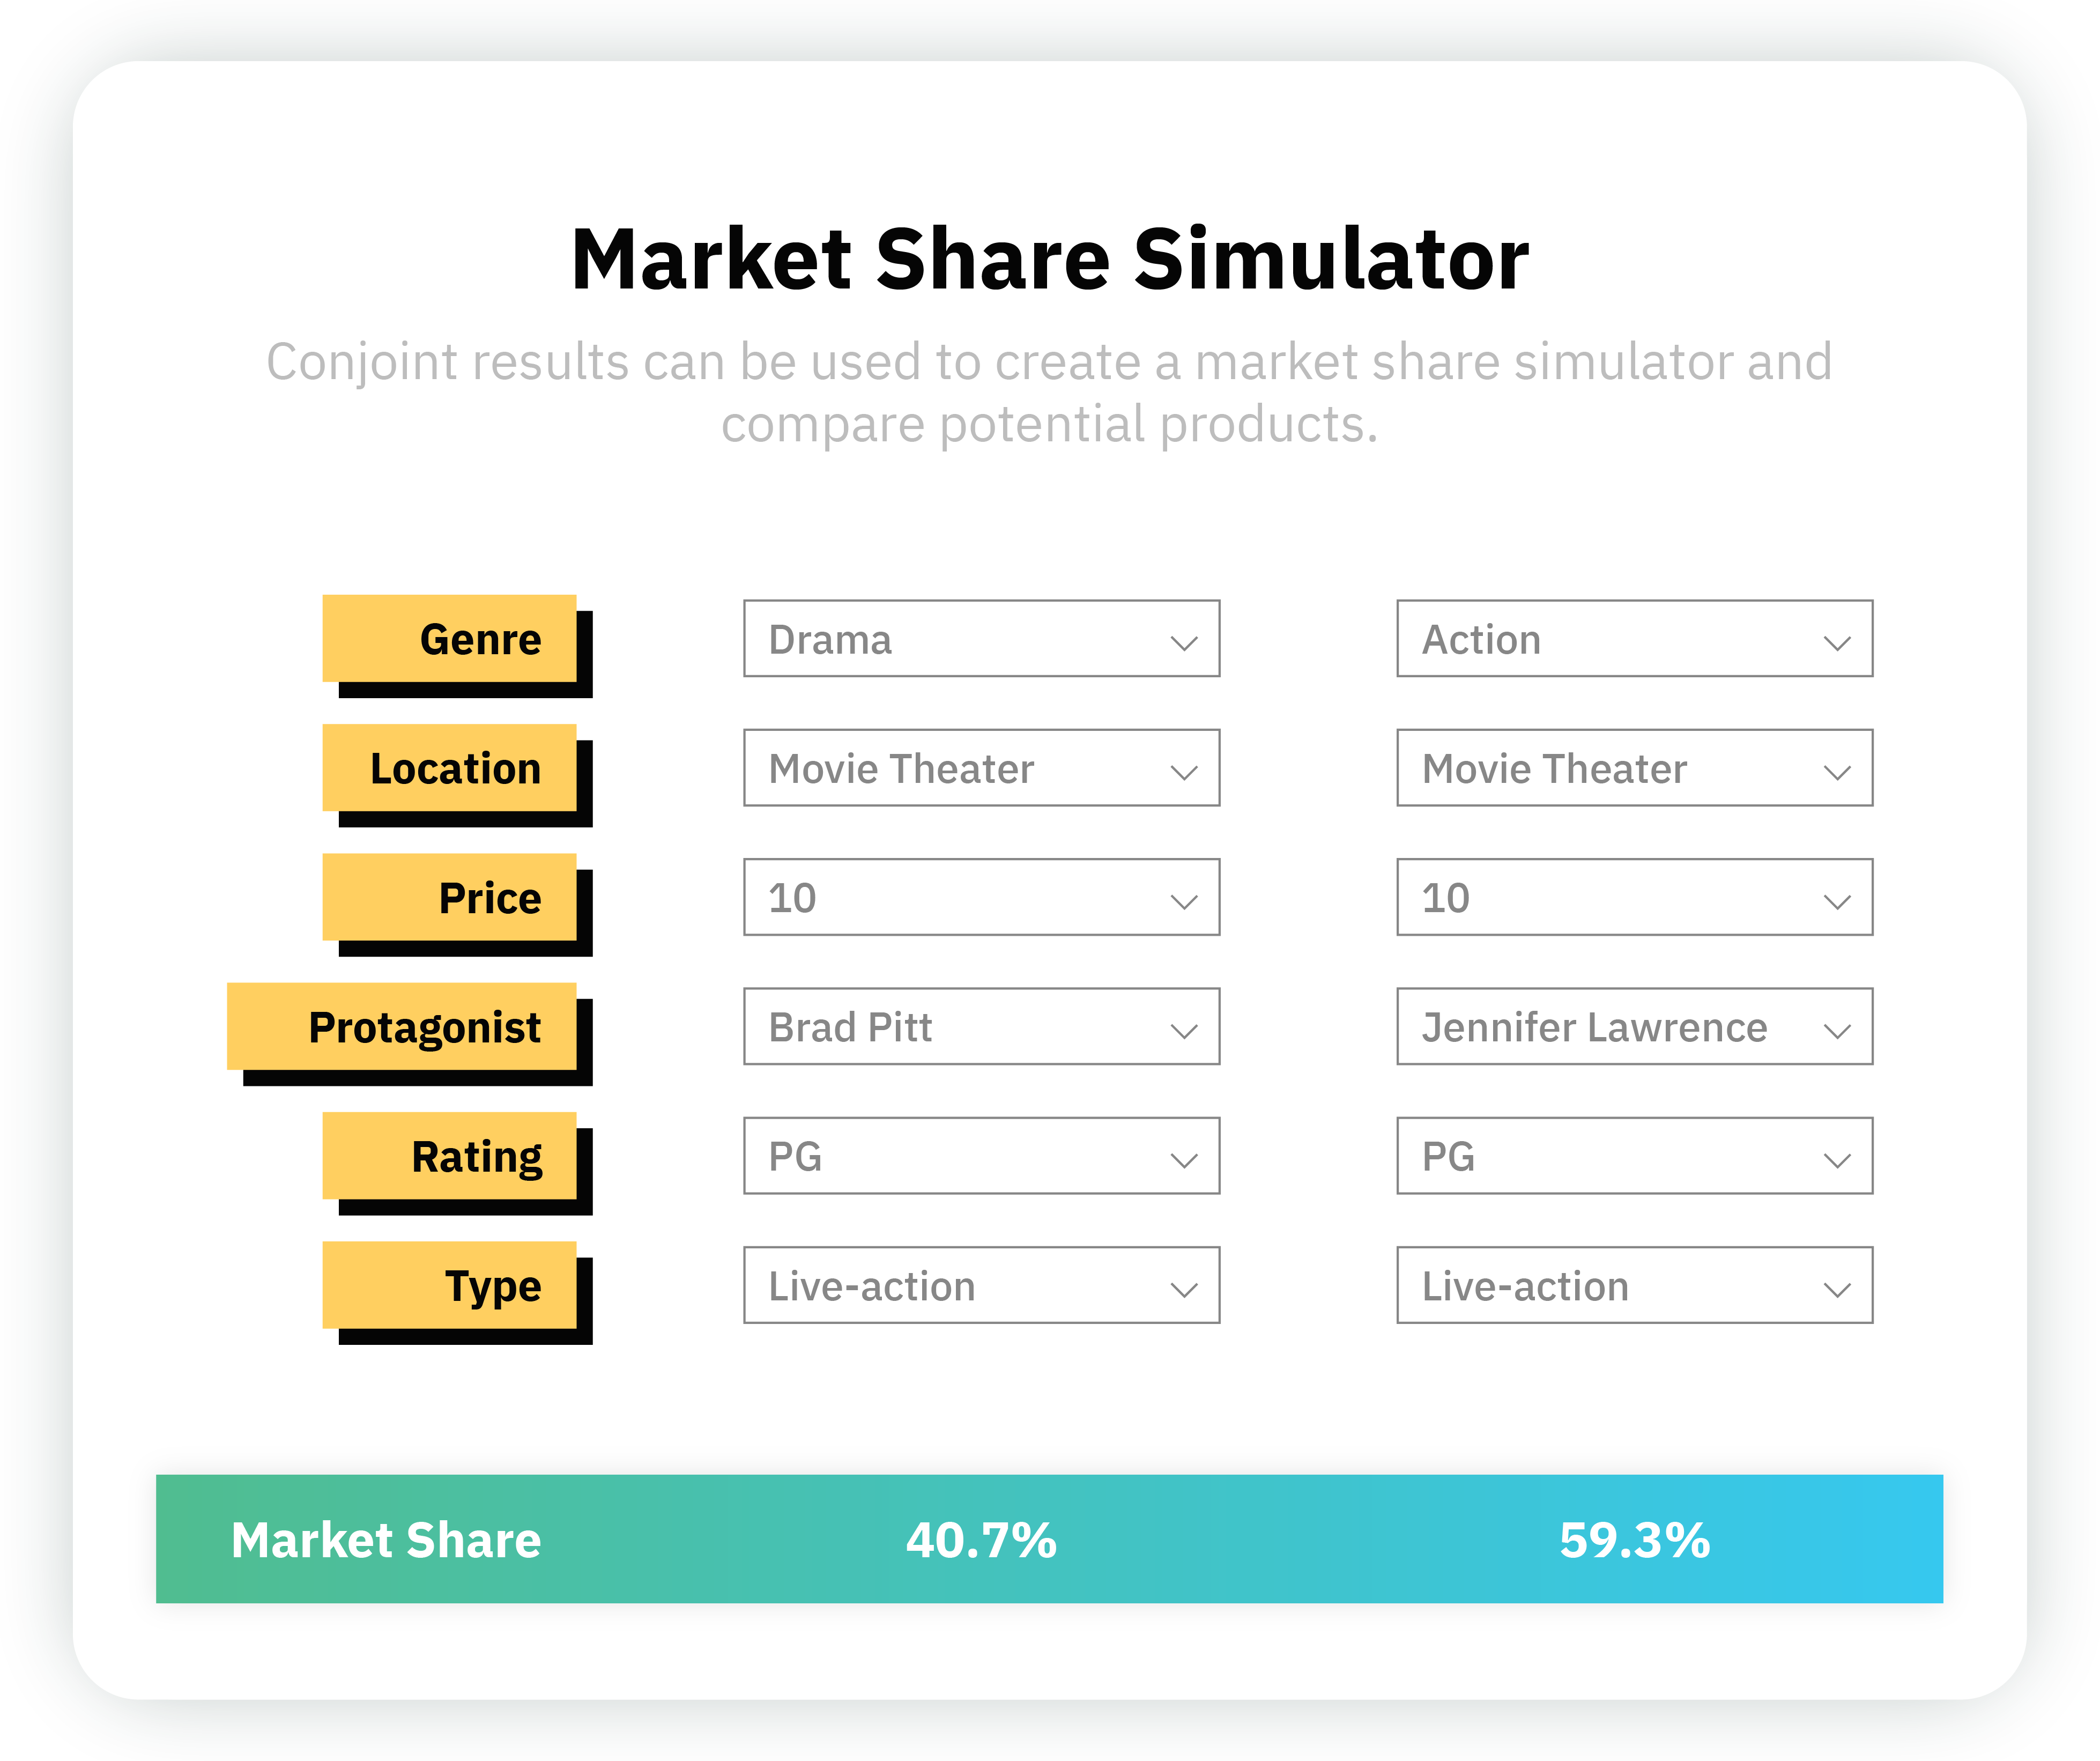
Market Share SimulatorA market share simulator is an interactive online tool that allows any approved user to examine how market share is affected by different combinations of product levels.


Frequently asked questions (FAQ)
Discrete choice analysis is examination of datasets that contain choices made by people from among several alternatives. Commonly, we want to understand what drives people to make these choices. For example, how does weather affect people’s choice among eating out, ordering food delivery, or cooking at home.
Conjoint analysis is a technique for quantifying how the attributes of products and services affect preference. It is typically used to help decision makers identify the optimal design of products and pricing.
The higher order product features. Examples of attributes for a laptop could be: brand, size, color, and battery life.
The different alternatives within each attribute of each attribute. Example levels within a brand attribute for laptops could be: Samsung, Dell, Apple, and Asus.
The hypothetical combination of attributes and their nested levels for a product or offering. There are usually at least two to choose from per task.
An ideal conjoint module will have roughly 5 attributes (rows), 4 levels per attribute (columns), and roughly 5 - 10 choice sets. A detailed breakdown is below:
Attributes - Roughly 5 attributes with no more than 10 total levels per attribute.
Profiles - Roughly 4 profiles to show each set. Too many profiles per set, and you risk respondents not making effective choices.
Total Tasks - No more than 15 to avoid respondent fatigue.We recommend collecting at least 100 responses for each audience sub-group to be analyzed. For example, if you wanted to research both males and females, you would want to collect 100 responses for both.
A part-worth (AKA part-worth utility or preference score) is a numerical score that measures how much each product feature influences the respondent’s selection of a particular concept.
The combination of levels that is the most preferred by an audience or the market.
The amount someone is willing to pay for a product feature as measured through a level in the conjoint.
Price elasticity relates to the aggregate demand for a product and the shape of its demand curve. It is calculated by plotting the demand (frequency count/total response) at different price levels.
Stories from the field
A showcase of the potential and versatility of discrete choice experiments.

Understanding Conjoint Experiments
Product Guide
Take a deep dive into conjoint experiments by going through our guide. Understand how to design a conjoint and get an appetizer of what the output looks like.
Download the product guide →
How Americans Define Success
Client Case Study
Gradient Metrics pushed a conjoint experiment to its limits, and designed an innovative approach to measuring success.
After an initial prototyping phase, our new methodology was rolled out on a national scale and has transformed how our client thinks about measuring Americans’ priorities across many domains.
Download the case study →
Understanding Willingness-to-Pay: Conjoint Analysis in Action
Client Case Study
A creative education platform approached Gradient to help them assess their class offerings and customer willingness-to-pay for those offerings. We used a conjoint analysis to determine the class offering features
most attractive to customers, what impact the offerings have on market share and revenue, who the platform should target, and more.
Who we’ve partnered with
The world's most forward-looking organizations trust Gradient


