Brand Perception
Are you tracking the performance of your organization’s most valuable assets?
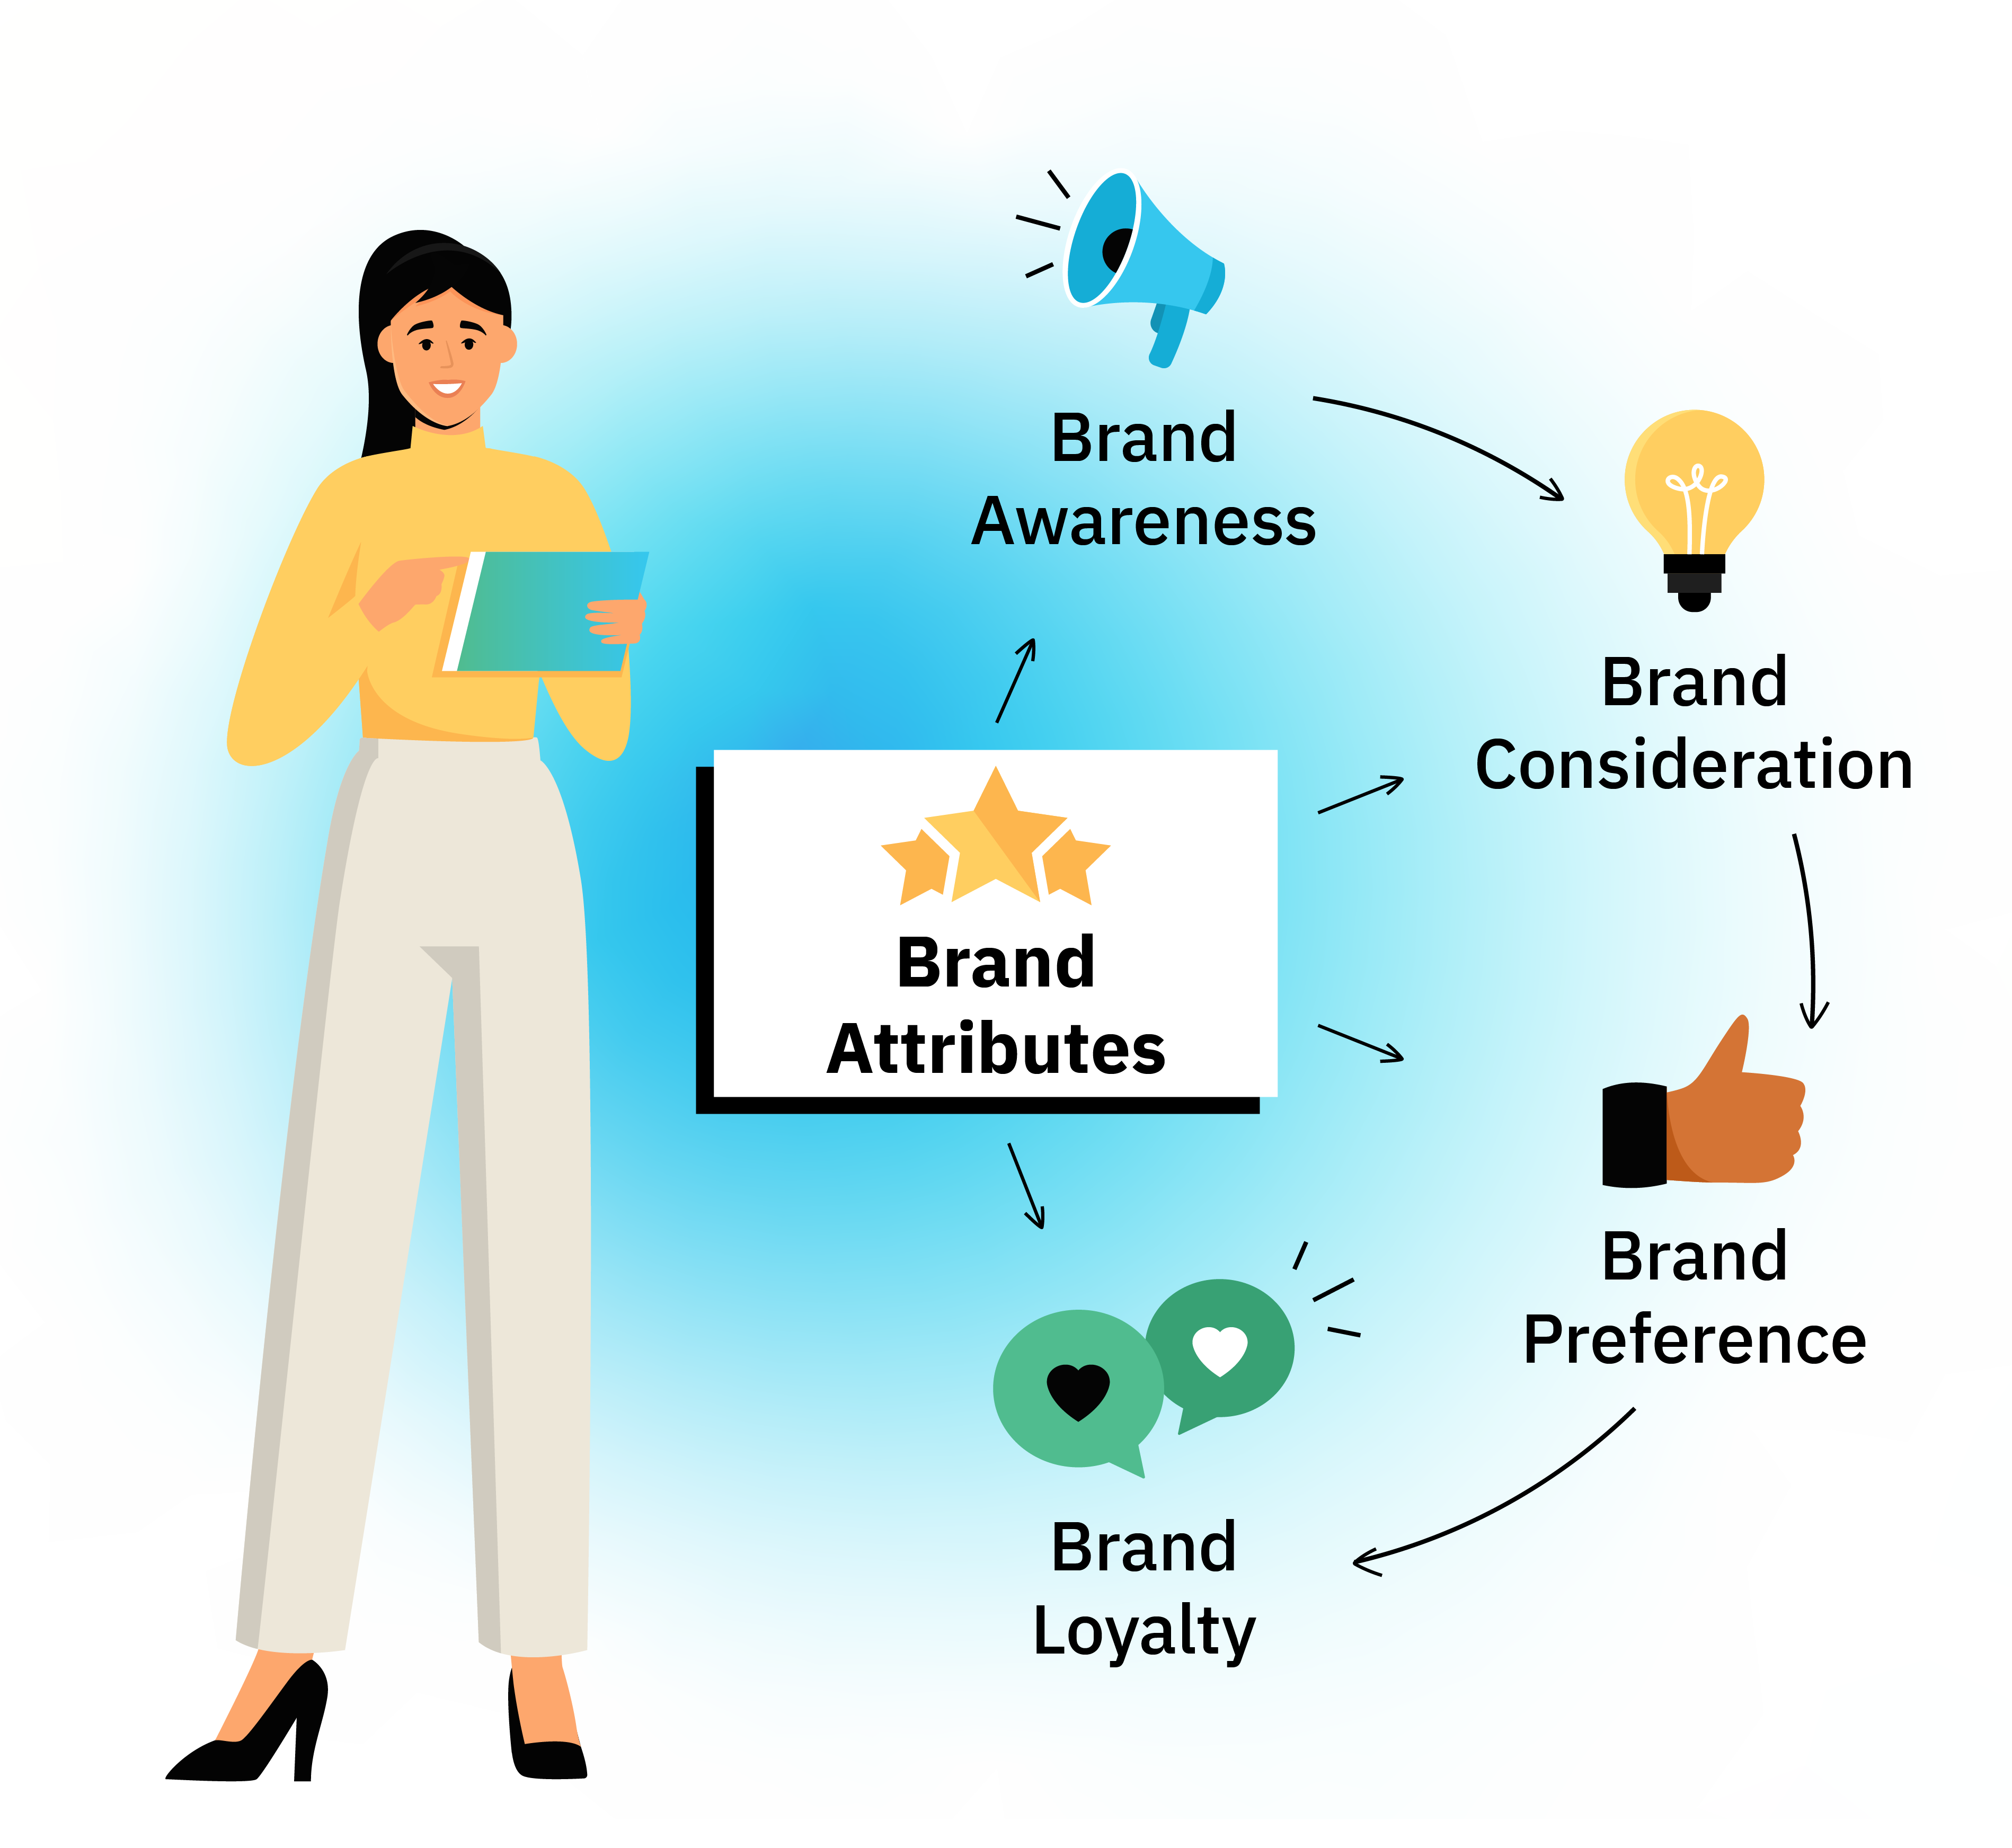
Build brand metrics that matter
Why you need them
Marketers have always had a love/hate relationship with brand trackers. The standard method of brand tracking is losing value quickly. For marketers it’s no longer enough to be aware of the performance of their brand—instead they need to understand where the key growth opportunities lie and how to influence them.
Powered by Bayesian data science, Gradient’s brand perception analysis will help you identify the clear growth opportunities in your brand funnel and tell you how to address them. Gradient estimates the causal relationship between key brand attributes and the brand equity metrics you care about through validated statistical models. These estimates are then reported in an easy to digest dashboard with clear recommendations, allowing any marketer to start making immediate improvements to their brand’s perception.
Understand the “behind-the-scenes” factors that drive brand and product choice
Benchmark your brand’s performance against competitors in your space
Take action to improve brand competencies and personalities
Our data science based approach
How it works
To measure your brand’s equities, respondents are first asked whether they are aware, have considered purchasing from your brand, and if they have actually made a purchase in the past. Next, each brand they are aware of is ranked across 10-15 specific brand equities that your company cares about (e.g., trendy, innovative, quality, etc.).
With this data, we will conduct a Bayesian regression analysis that measures the causal relationship between which brand equities are most predictive of awareness, consideration, purchase, or any other outcome variable of interest (e.g., LTV, annual spend, or tenure). This will provide you with the brand qualities that high-value and other customers care about most and those that are less relevant across the full competitor set.
We will build a survey-based experiment designed in tandem with your needs
We use state-of-the-art statistical techniques to connect the dots from the survey inputs to your research needs
With custom visuals and easy-to-understand diagrams, we deliver a shared vocabulary for key brand metrics
Understand your clients' top concerns and how your competitors rank
What you get
-
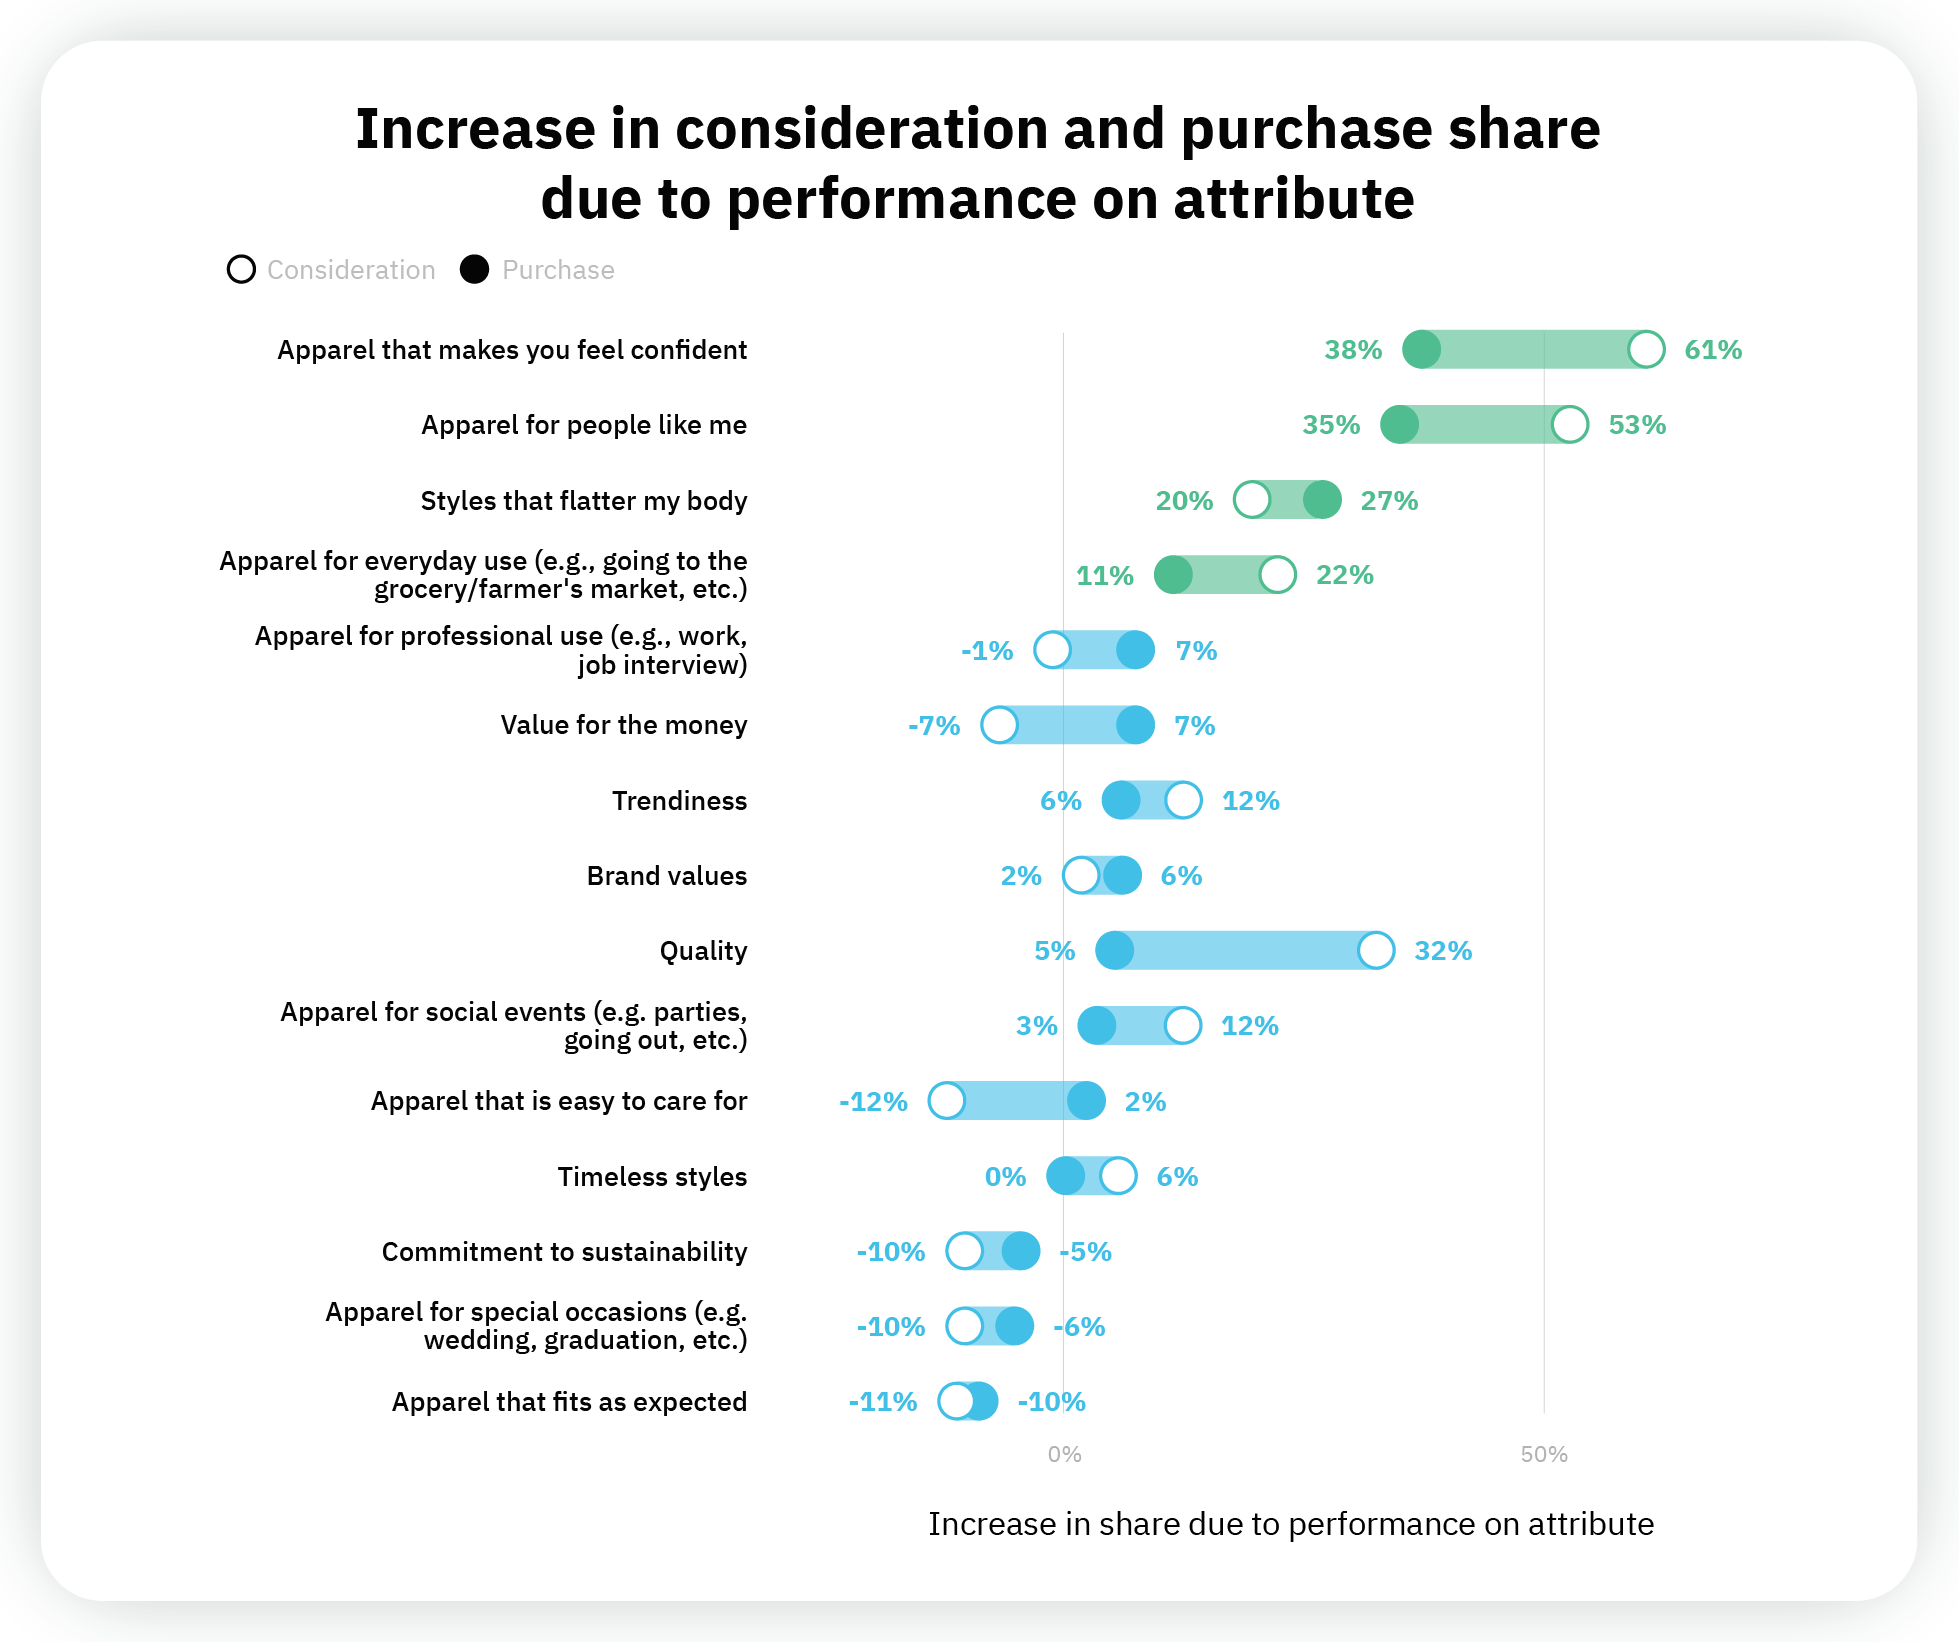
Consideration and Purchase Shares by Attribute
The consideration and purchase share of an attribute represents how correlated ratings on a particular attribute are with the probability of a client considering or actually purchasing from your brand.
Increases in consideration and purchase shares due to attribute performance explain how much more or less likely an individual will be to consider or purchase from your brand for every unit an attribute is rated higher.
-
Attribute Importance on LTV
Attribute ratings can be mapped onto your customer data to elucidate how higher attribute ratings are related to increases or decreases in your customer’s lifetime value or any other marker of your customers’ value.
-
Attribute performance ratings
Using attribute performance ratings, the health of your brand and its competitors can be assessed across the attributes most related to increasing consideration and purchase.
-
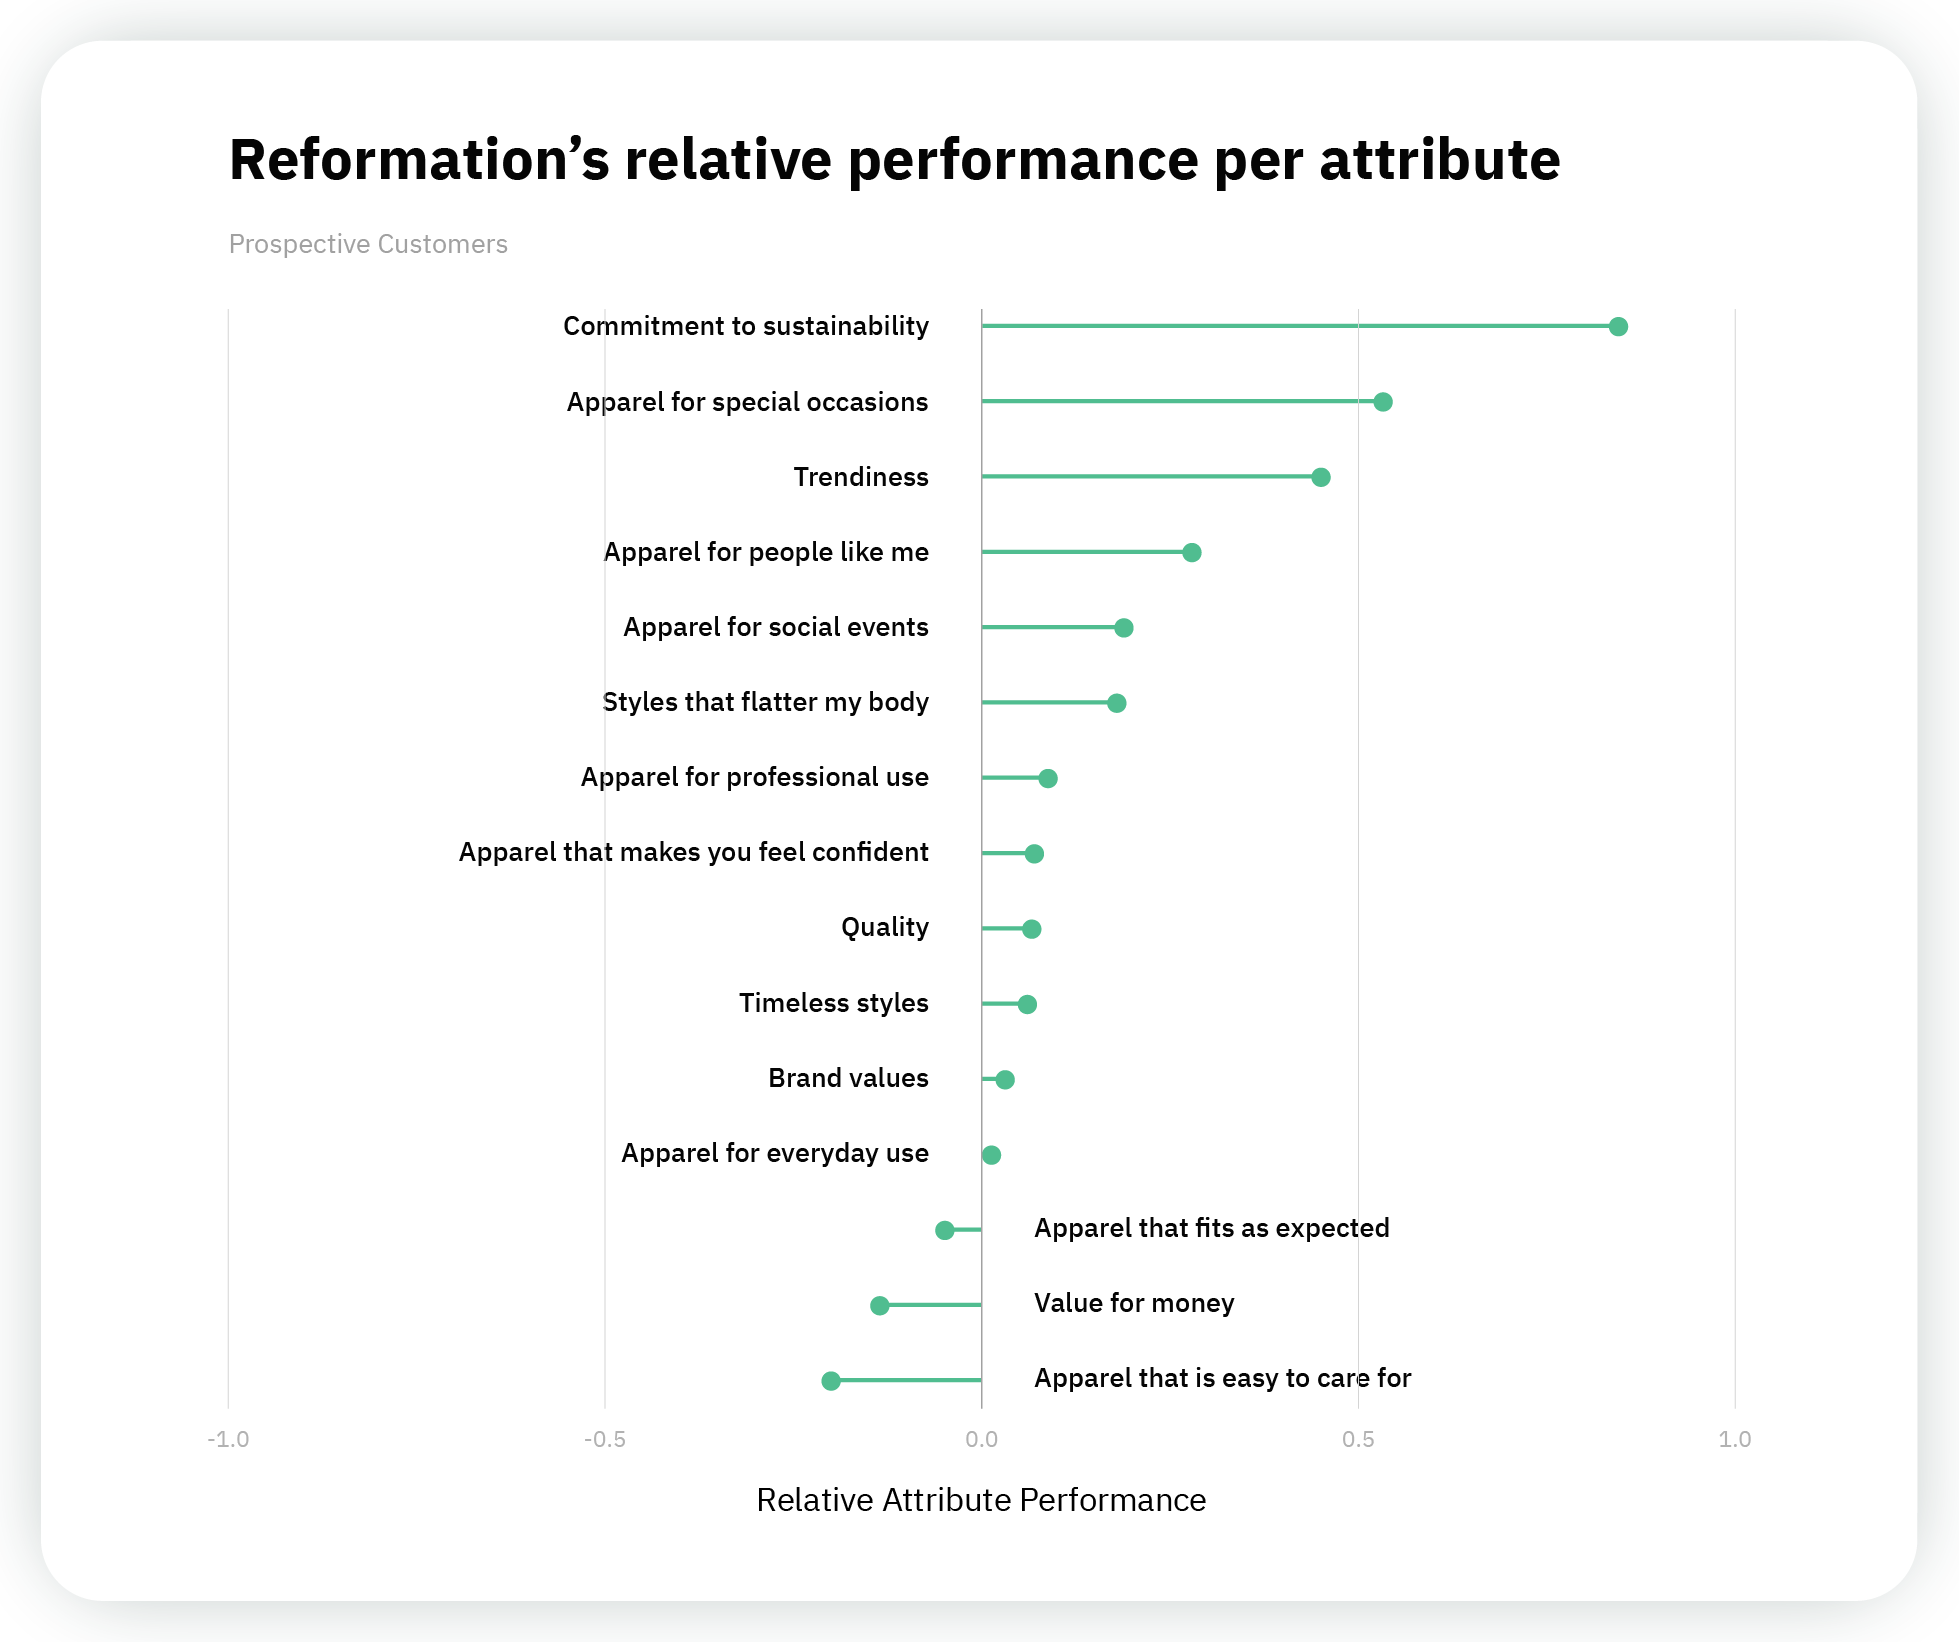
Relative performance indexThe relative performance index shows how well your brand is rated across attributes relative to the ratings of all your competitors.
.png)
.png)
Frequently asked questions (FAQ)
We typically take 1-2 weeks to develop the survey instrument, 1-2 weeks to collect the data, and an additional week to model, analyze and synthesize the results.
Yes. Our general recommendation is to spend more time and effort on the initial survey instrument to reap the benefits later. We recommend a cadence of once a quarter or twice a year.
We build our statistical models to control for outside effects such as demographics, so you can feel confident about the causal relationship between your brand equities and outputs of interest.
Stories from the field
Check out how our customers have used brand perception to achieve their business goals.
Brand Perception Analysis with Reformation
Client Case Study
To create an actionable marketing plan for Reformation, Gradient Metrics designed a brand perception analysis that could surface the brand equities most associated with considering and purchasing clothing from a brand.
Starting with a brand funnel, Gradient revealed the extent to which prospective customers were aware, had considered, and had purchased from Reformation and its competitors.
Pairing the brand funnel with attribute ratings led to critical findings, including the attributes most associated with considering and purchasing from a brand, and where Reformation ranked on the most influential attributes relative to their competitors.
Download the case study →
Obtaining Brand Metrics Through Baysian Inference
Whitepaper
Gradient helps clients understand their brand in a way that isn't possible with simple off the shelf solutions. We apply a bespoke Bayesian approach to estimate the parameters that you care about with a lot of confidence. Learn more about our Bayesian applications in this whitepaper.
Read the whitepaper →.png)
Meal Kit Brand Metrics
Trendlines Public Opinion Survey
Thanks to a representative survey to 1,000 Americans, Gradient developed a statistical model identifying the meal kit brands with the most growth potential and analyzed the brand attributes (equities) most associated with increased consideration and purchase rates of those meal kits.
The results will probably make you hungry.
Read the full story →Who we’ve partnered with
The world's most forward-looking organizations trust Gradient


